

School Tutoring
University Tutoring
Professional Tutoring
Real Progress. Proven Results.
Each year, Spires confirms that exceptional 1-1 tutoring can deliver the academic benefits of private schooling – at a fraction of the cost.
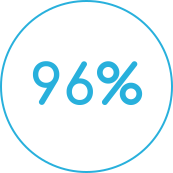 Gained +2.0 grades on average
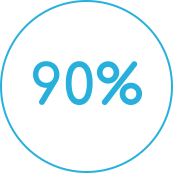 Achieved GCSE grades 9-6
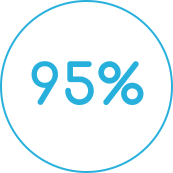 Scored A*-C in A-Levels
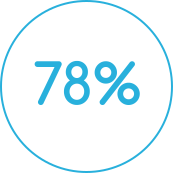 Attained 2.1 or above
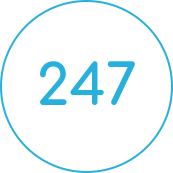 Total student responses worldwide
GCSE Results
We are delighted to report that our GCSE results have risen to record levels, with Spires students now more than 6x more likely to achieve a grade 9 than the average UK student.
| Academic Year / Cohort | Final Grade Achieved | Average Tutoring Hours | Average Grade Improvement | Number of Students | % Achieving Grade or Higher | National Average (%) |
|---|---|---|---|---|---|---|
| 2026 | 9 | 26 | 2 | 23 | 33.33% | ~5% |
| 8 | 37 | 2 | 14 | 53.62% | ~12.20% | |
| 7 | 39 | 2 | 14 | 73.91% | ~21.8% | |
| 6 | 29 | 2 | 11 | 89.86% | ~35.60% | |
| Total | 9–6 | 32 | 2 | 62 | 89.86% | ~35.60% |
Top Highlights

74% achieved 9–7 in 2026, exceeding the 63% average across England’s grammar schools (Source: Qualification results in England: summer 2026).

54% secured grades 9–8 in 2026 (over 4x the national average), placing more than half of surveyed Spires students in the highest GCSE grade band.

90% attained grades 9-6 in 2026 (2.5x the national average). Remarkably, the average student started at a grade 5, which highlights the importance of a Spires tutor.

96% of GCSE students improved by an average of +2.0 grades with just 32 hours of tutoring in 2026.
GCSE Results Methodology
Our 2026 GCSE results are based on data collected through surveys distributed to Spires tutors, who were asked to report the academic outcomes of students they supported during the year. The findings reflect the final GCSE grades achieved by students whose results were reported, alongside their starting grades, average tutoring hours and grade improvements where this information was available......
A-Level Results
Our tutors helped over 100 A-Level students reach their academic potential in 2026, with A* grades awarded at twice the national rate.
| Academic Year / Cohort | Final Grade Achieved | Average Tutoring Hours | Average Grade Improvement | Number of Students | % Achieving Grade or Higher | National Average (%) |
|---|---|---|---|---|---|---|
| 2026 | A* | 47 | 2 | 22 | 20.18% | ~9.60% |
| A | 32 | 2 | 41 | 57.80% | ~28.50% | |
| B | 33 | 2 | 28 | 83.49% | ~55.80% | |
| C | 40 | 2 | 12 | 94.50% | ~78.40% | |
| Total | A–C* | 37 | 2 | 103 | 94.50% | ~78.40% |
Top Highlights
58% obtained A*-A in 2026, twice the national average and exceeding the 43% average across England’s grammar schools (Source: Qualification results in England: summer 2026).
95% achieved A*-C in 2026 (national average: 78%).
83% attained A*-B in 2026 (national average: 56%).
95% of A-level students jumped +2.0 grades with just 37 hours of tutoring on average in 2026.
A-Level Results Methodology
Our 2026 A-Level results are based on data collected through surveys distributed to Spires tutors, who were asked to report the academic outcomes of students they supported during the year. The findings reflect the final A-Level grades achieved by students whose results were reported, alongside their starting grades, average tutoring hours and grade improvements where this information was available......
IB Results
Our 2026 IB results reflect outstanding academic achievement, with 1 in 3 students securing a 7, the highest possible grade.
| Academic Year / Cohort | Final Grade Achieved | Average Tutoring Hours | Average Grade Improvement | Number of Students | % Achieving Grade or Higher | Global Average |
|---|---|---|---|---|---|---|
| 2026 | 7 | 32 | 3 | 11 | 34.38% | ~9% |
| 6 | 62 | 2 | 8 | 59.38% | ~30% | |
| 5 | 54 | 2 | 12 | 96.88% | ~57.3% | |
| Total | 7–5 | 48 | 2 | 31 | 96.88% | ~57.3% |
Top Highlights
Students who scored a 7 required the fewest tutoring hours (32 on average), yet reported the greatest average grade improvement (+3 grades).
97% achieved grades 7–5 in 2026 (nearly 2x higher than the global average).
59% obtained grades 7–6 in 2026, having improved by an average of +2.0 grades.
100% of IB students moved up +2.0 grades on average with just 47 hours of tutoring in 2026.
IB Results Methodology
Our 2026 IB results are based on surveys distributed to Spires tutors, who were asked to report the academic outcomes of students they supported during the year. Tutors provided information on students’ starting and final IB grades, tutoring hours and grade improvements......
Undergraduate Results
With the majority of our tutor network holding postgraduate qualifications, Spires continues to excel in undergraduate tutoring, with 1 in 3 students achieving a First-Class in 2026.
| Academic Year / Cohort | Final Grade Achieved | Average Tutoring Hours | Average Grade Improvement | Number of Students | % Achieving Grade or Higher | National Average (%) |
|---|---|---|---|---|---|---|
| 2026 | 1st | 53 | 3 | 13 | 35.14% | ~33% |
| 2:1 | 63 | 2 | 16 | 78.38% | ~77% | |
| 2:2 | 12 | 2 | 7 | 97.30% | ~95% | |
| Total | 1st–2:2 | 51 | 2 | 36 | 97.30% | ~95% |
Top Highlights
First-Class achievers recorded the greatest academic improvement, with the average student starting on a Third prior to tutoring with Spires.
78% scored a 2:1 or First-Class result in 2026 (that’s nearly 8 in 10 Spires students).
95% achieved a 2:2 or higher in 2026, demonstrating strong academic attainment across the cohort.
97% of undergraduate students gained +2.0 grades on average with 50 hours of tutoring in 2026.
Undergraduate Results Methodology
Our 2026 undergraduate results are based on data collected through surveys distributed to Spires tutors, who were asked to report the academic outcomes of students they supported during the year. The findings reflect the final degree classifications achieved by students whose results were reported, alongside their starting classifications, average tutoring hours and academic improvements where this information was available......
Understanding Our Results
We believe in being transparent about how our results are collected and what they represent. While our findings highlight the academic achievements of Spires students, several factors should be considered when interpreting them.
How We Collect Results: Our findings are drawn from surveys completed by Spires tutors, who share the grades and academic progress of students they have supported. As these outcomes are self-reported rather than independently verified, they should be viewed as indicative of student performance.
Differences Between Student Groups: Students who seek private tutoring may already be highly motivated to improve their grades or have access to additional educational resources. These differences can influence academic performance and should be considered when comparing Spires’ results with national or global averages.
Representation of Student Outcomes: Our published figures reflect the students whose results were shared by participating tutors, rather than our entire student population. Students who stopped receiving tutoring or whose outcomes were not reported may not be represented, meaning the findings may not capture the full range of experiences and results across Spires.